Project goal:
The main goal of this project is to create a dashboard to analyse the video games sales data from various perspectives using tableau.
Data:
The video games sales dataset, which includes about 16000 rows and 17 columns, was selected from Kaggle. All the NA values were ignored and eliminated the duplicate rows.
Here is the link to the dataset - link.
Questions:
After analyzing the sales data, we came up with a number of questions by taking into consideration various dataset columns to design an interactive visualization.
- Compare the video game sales over the time period based on rank?
- Over the years, which publisher sold the most video games and did they focus on any region in particular to sell their products?
- Does the number of users or critics have any effect on the sales of the particular platform or genre or publisher? For instance, regardless of the number of votes, few individuals may see a movie depending on its IMDB rating?
- Failing to adapt in accordance with consumer expectations can result in misfires like Nokia. Did the publisher notice the same impact on sales over time based on platform?
- In terms of genre, how have gaming trends altered throughout time?
- Did the publisher have to concentrate on a certain area to increase sales?
- Considering the global sales, which games category have seen less sales?
Design Process:
Following the data exploration, we then started with initial sketches to explore few of the questions.
- Top 10 Video Games Since the first chart for the top 10 video games uses vertical bar charts and does not clearly indicate which game is ranked 1 or 2, or 3, we've included a horizontal bar chart with a rank number.
- Sales Analysis by Region In order to analyze sales by region, we first created a line chart with sales made by publishers in each zone on the x-axis; however, because there are four regions, the lines occasionally overlap. To overcome this, we chose bar chart for plotting 'Sales analysis by region' with the top 10 publisher's sales shown on the x-axis for each region which makes it easier to compare sales across regions.
- Sales % by Region To display sales percentages by region we originally chose a dual-axis bar chart to display percentages inside the bars and total sales on top, but it wasn't very apparent, so we went with a pie chart and an action filter for each region instead.
- User and Critic Number by Sales for Genre In order to compare user and critic numbers to sales by each genre, we first created a line chart by user and critic numbers. However, the lines appeared to be too crowded, so we decided to create the same dual axis chart instead, with bars representing sales and lines representing user and critic numbers.

Design Choice:
The main objective is to develop an interactive dashboard that compares the video game sales analysis over time by considering the below five primary columns from the dataset.
- Games
- Publishers
- Platform
- Genre
- Region
So, we then linked them step-by-step accordingly and below are the findings for each plot.
Findings:
Following the data exploration, we then started with initial sketches to explore few of the questions.
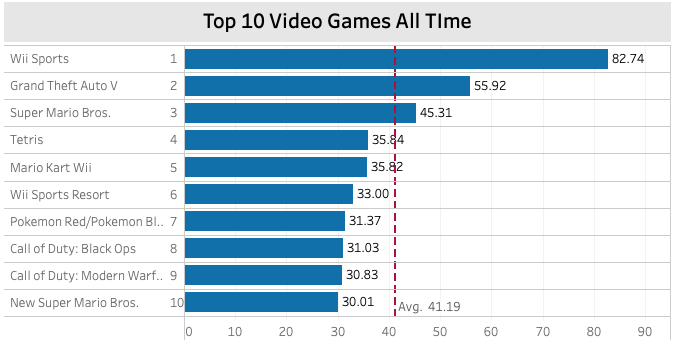
- Top 10 Video Games All Time
The top 10 video games of all time are displayed in a bar graph along with their overall average sales of 41.19 million. As we can see, Wii Sports is ranked number one overall with 82 million sales, followed by Grand Theft Auto V with 55 million and Super Mario Bros with 45 million global sales.
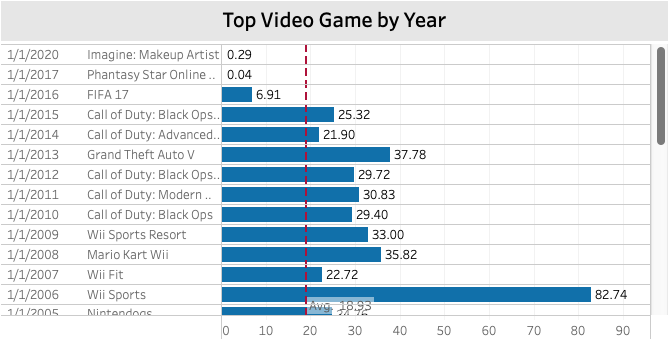
- Leading Game of each year
The top game each year is displayed in the horizontal bar graph. And with 82 million sales in 2006, Wii Sports has the biggest sales in a single year.
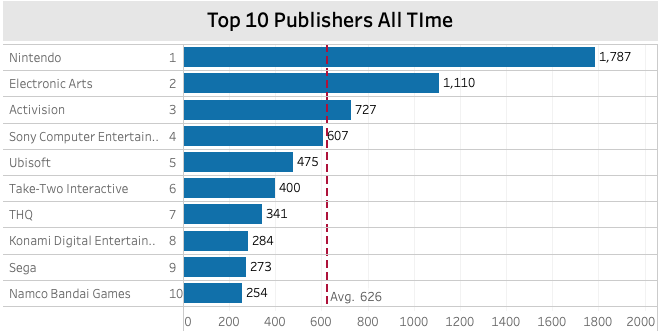
- Top 10 publishers all time
The top 10 publishers of all time are displayed in a bar graph, with an average sale of 626 million. Global sales of 1787 million put Nintendo in first place. Electronic Arts and Activision were in second and third, respectively, with 1110 million and 727 million global sales.
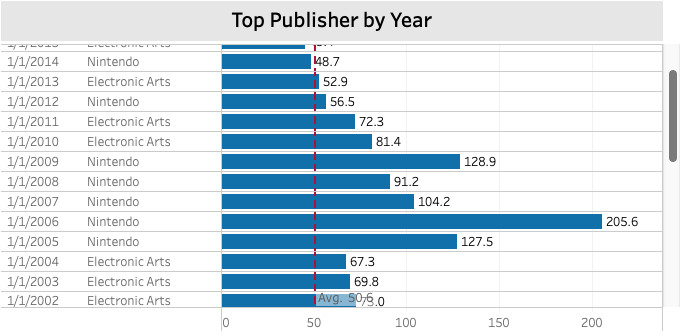
- Leading Publisher by each year
The horizontal bar chart identifies the top publisher each year, with Nintendo and Electronic Arts dominating the list. Of them, Nintendo had the greatest sales in a single year as a publisher, with 205 million in 2006.
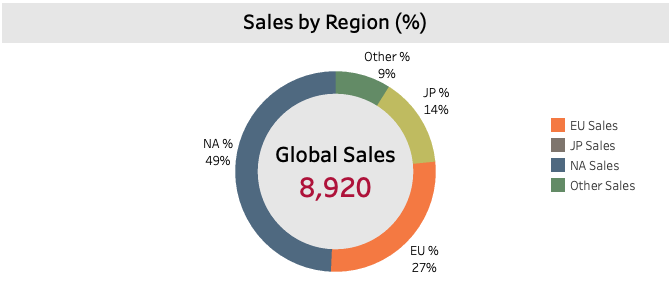
- Sales percentage by region
The pie graph displays the percentage of games sold by region. Whereas just 9% of global sales are made in other regions, North America leads with 49%, followed by the European Union at 27% and Japan at 14%.
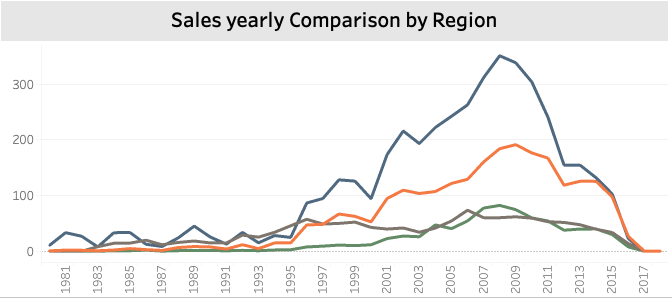
- Yearly comparison of sales by region
Annual comparison of sales prices by region shows that North America has the greatest sales overall, with 351 million in 2009, followed by the European Union, with 191 million, which represents the biggest sales ever in a single year. The sales of video games were not very high until the late 1990s, but they gradually rose from 1996 to 2010. But from that point forward until 2020, sales started to fall again. The increased use of mobile devices from 2010 may be one of the reasons.
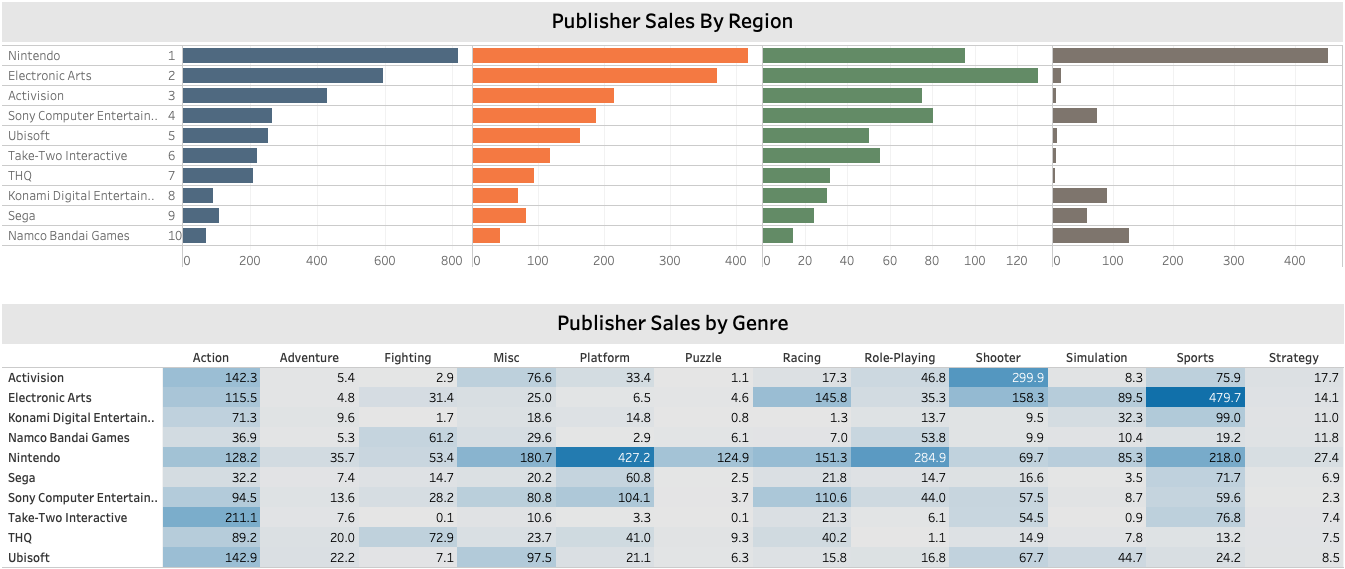
- Publisher sales by genre
We have a crosstab in this area that compares publishers based on the sales of the genre. Here, we can even see that a small number of publishers are producing games across a variety of genres, such as Electronic Arts, which produces games in the racing, shooter, and sports genres as well. The sports category led with 480 million dollars in global sales overall. Nintendo came in second with 430 million dollars in global platform game sales and 300 million dollars in role-playing game sales.
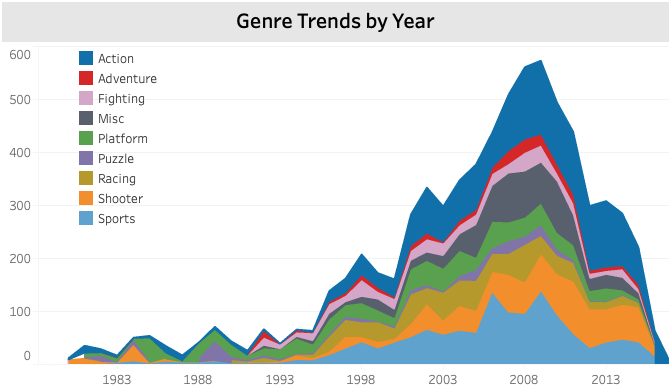
- Genre Trends by year
Here is a comparison of game types by genre year over year. As you can see, action games are popular throughout the entire time period, followed by adventure games, fighting games, miscellaneous games, and platform games. However, over the past ten years, the gaming industry has seen a sharp decline in game sales. Compared to other genres, the sports game industry is showing the least trend.
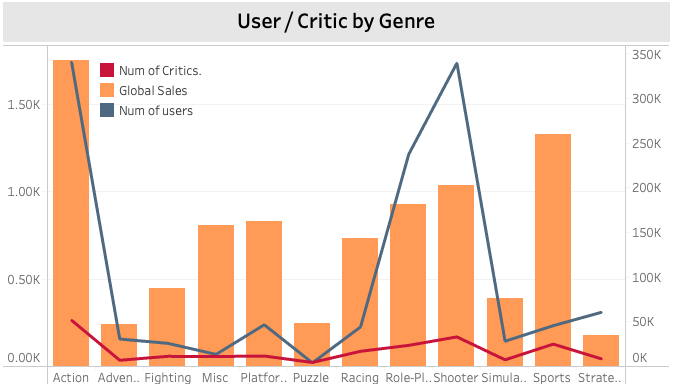
- User and critics number by genre
In this graph, the bars represent global sales by genre, the lines represent user and critic numbers, and it is clear that most genres are following the general trend. With the exception of a few genres, such as fighting games, where we can observe that sales are higher but users are lower, this is because fighting games are more expensive than other genres, which increases sales, but many users are lower relative to that. The same is true for sports games.
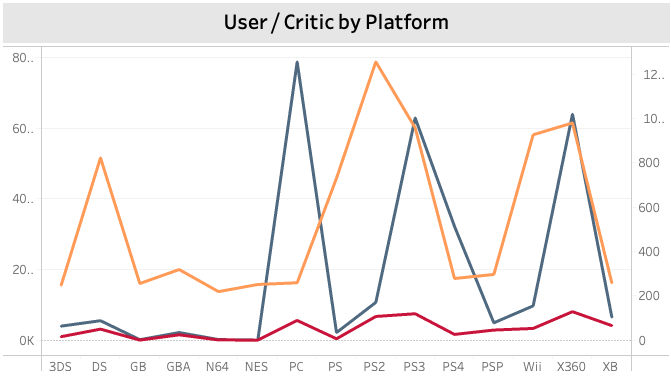
- User and critics number by Platform
When we compare the number of users to the largest number by platform, we can see that the trend is consistent throughout. This is because, for the most part, the number of users on a platform equals the number of sales made through that platform, and the platform-based prices are mostly similar.
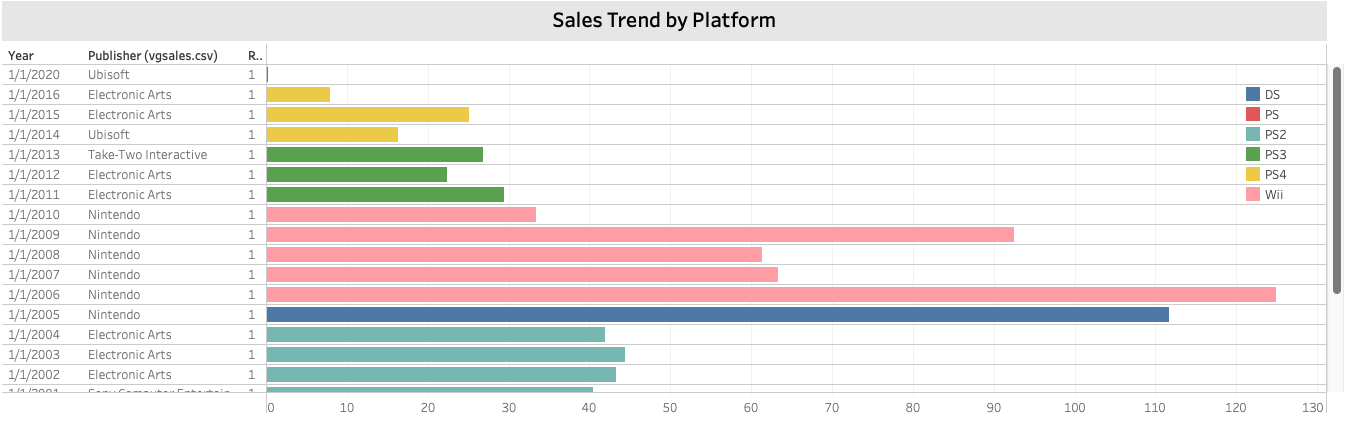
- Sales trend bar platform
In this graph, we have compared the Publishers by the platform annually, and we can see that Nintendo is having the most sales in a year from 2006 to 2010, which was the period and Era of platform-based games. However, platform-based games are becoming less popular over time as more people play games on a single device, such as the PC, PS4, Xbox One, etc. Publishers that produce games for several platforms are now more successful, such as electronic Art.
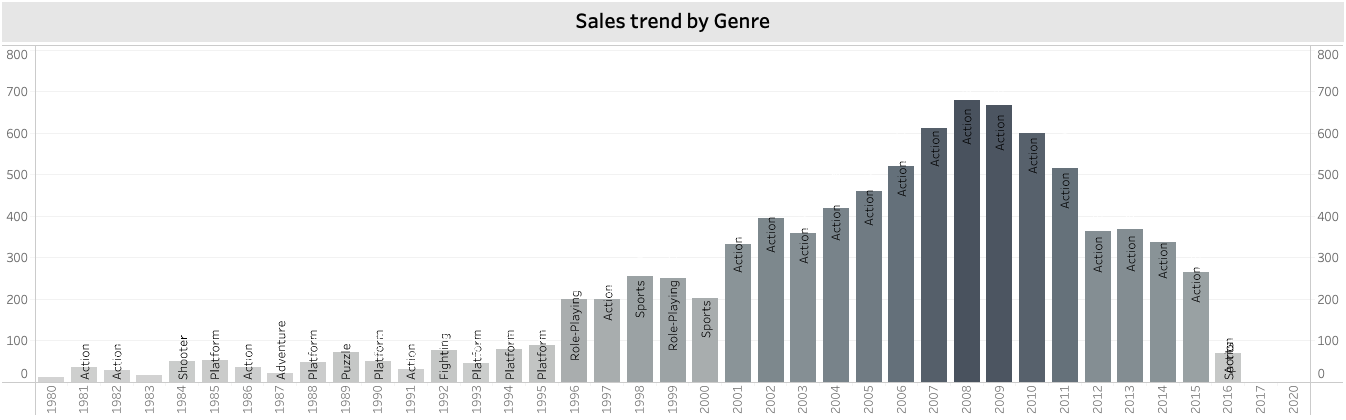
- Sales trend by genre
This graph displays sales by genre year over year over the past 20 years, and it is clear that the action genre has dominated.
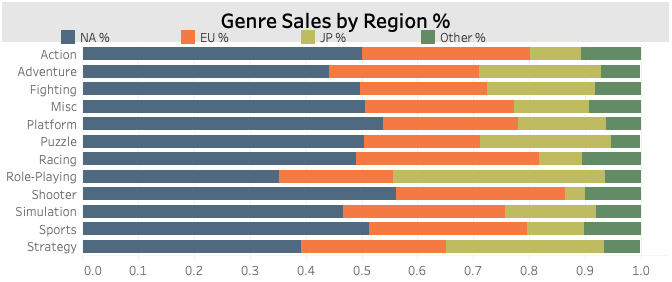
- Genre Sales by Region %
Here is a comparison of each genre by region. As you can see, all but strategy- and role-playing games have about the same tendency in North America. And it's clear that role-playing games are the most popular in Japan.
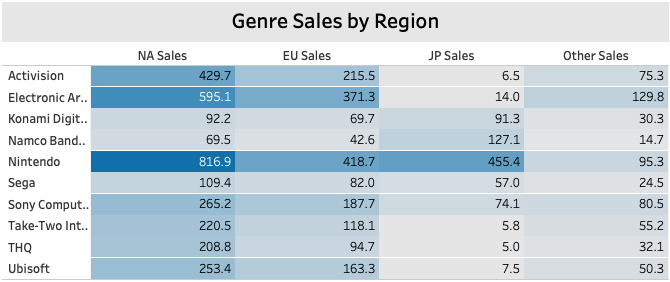
- Genre sales by region Crosstab
This graph displays genre sales by region, and since Nintendo also produces role-playing games, we can observe the trend of high total sales for Nintendo in Japan. As we can see, Nintendo dominates the North American market with 816 million sales. Activision came in at 430 million, and electronic arts came in at 595 million in North America.
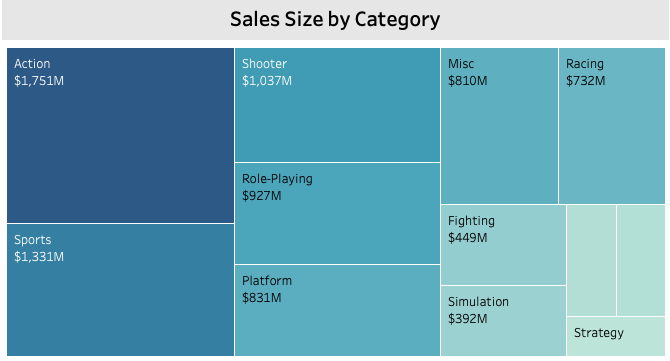
- Sales count by category
If we examine cell size by genre, we can observe that action games have the highest global sales (1751 million), followed by sports and shooter games, while strategy games have the lowest sales (175 million).
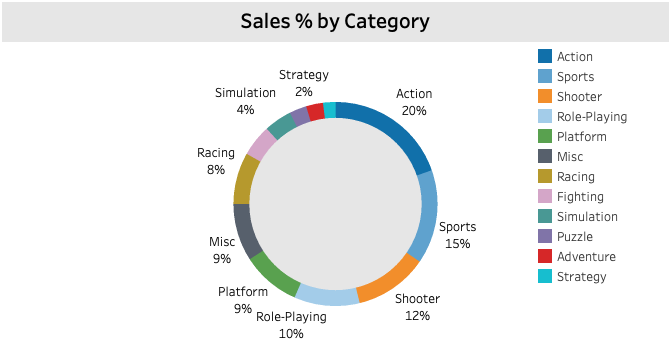
- Sales percentage by category
We can observe that action games sell the most sales, accounting for the largest percentage of all games (20% of the total share), followed by sports (15%) and shooter games (12% of the total share).
Individual Contributions:
- Shiva Raju Gollapally Krishna - Initial questions, worksheets, dashboard interactions, building website
- Soumith Paritala - Initial Sketches, worksheets designing, idea for dashboard design/format, Final dashboard wraping
- Ganesh Pinnika - Data selection, Cleaning the file, worksheets designing, video explanation